 ANZBMS 2026
 REMS derived bone mineral density (BMD) variability observed across age and BMI segments from a large Australian patient cohort (#236)
REMS (Radiofrequency Echographic Multi-Spectrometry, TGA approved Oct 2020), measures bone mineral density (BMD), provides T-scores and diagnosis (Normal, Osteopenia or Osteoporosis). REMS technology is founded on RF backscatter analysis data grouped into 5-yr age segments and BMI stratification. Pivotal studies demonstrated high concordance with DXA(1), with some expected BMD variation, but several recent small-sample clinical studies have failed to show similar variation.
Aim. We conducted a retrospective analysis of 1284 women from an Australian REMS clinical practice (May-2023 to Dec-2025) who gave consent for the use of their de-identified data.
Methodology. Age, BMI, BMD (g/cm2) and T-score at the lumbar spine (LS) and femoral neck (FN, right and left) were recorded. Results were collated into the same 5-year age (20–90) and three BMI segments (normal/underweight, overweight, obese) that replicated the REMS development structure. A minimum of 25 scans/segment was chosen to ensure adequate sample sizes.
Results. Patient data was recorded in 39 of the 42 possible age/BMI segments. 19 segments had >25 scans, in ages 41-80. 18 segments demonstrated T-scores ranges of >1.5 standard deviations. Five FN segments and ten LS segments demonstrated T-score values spanning normal bone mass (>-1.0) to Osteoporosis (<-2.5). BMD plotted against BMI per age segment found increased variance in LS compared to the FN (Figures 1a and 1b).
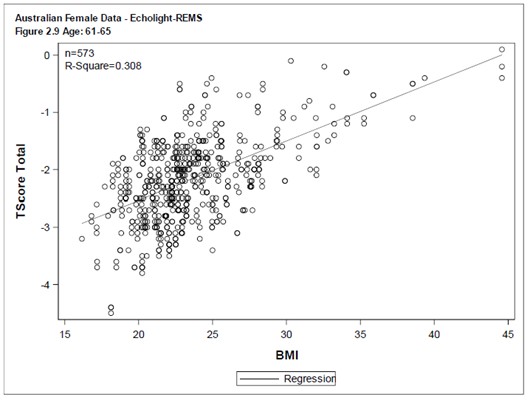
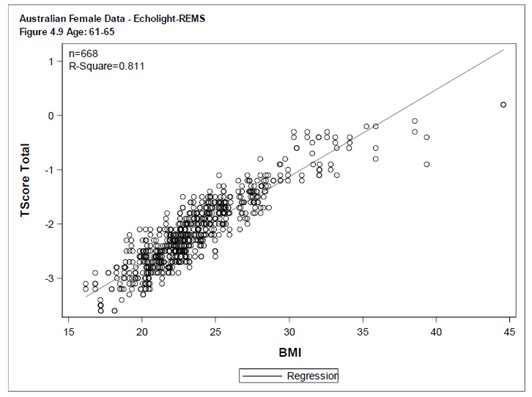
Figure 1a&b. T-score scatterplots from 61-65 year-old patients. LS (Fig-1a. n=573) and FN (Fig-1b, n=663). R2 for LS=0.308 and for FN=0.811
Key Clinical Findings. By collating our data into the same age&BMI segments as the REMS technology, we could observe real world BMD variability. BMD & T-scores increased with higher BMI. R2 values for the LS showed moderate association and higher variability compared to the FN.
Encouragingly, REMS demonstrated BMD ranges from normal to osteoporosis within some age/BMI segments. Further data analysis showed very little difference between adjacent segments. These results suggest that RF backscatter data contributes significantly to the REMS derived BMD and REMS is not overly reliant upon anthropometric inputs (i.e. age and weight).
Further analyses on larger sample sizes, with similarly tightly defined categories, as well as data from paired REMS-DXA scans are warranted
- 1. Fuggle N, Reginster J-Y, Al-Daghri N, et al. Radiofrequency echographic multi-spectrometry (REMS) in the diagnosis and management of osteoporosis: state of the art. Aging Clinical and Experimental Research (2024) 36:135 https://doi.org/10.1007/s40520-024-02784-w